
Welcome to this week’s Field Notes, a 10-year project of mine documenting humankind’s digital transition from the field. These notes are shaped by what I’m seeing, building, and discussing as our physical and digital lives continue to converge.
- Ryan
(Connect with me on LinkedIn)

News is surface-level. Signals live underneath. This section captures developments that hint at deeper shifts in how digital systems are being built, governed, and adopted — often before they’re obvious in the mainstream narrative.
Mapping 25 million cells in the human brain and beyond
For centuries, our understanding of the brain has developed through increasingly sophisticated ways of observing it. Early anatomists examined its physical structures, microscopes revealed the neurons within them, and modern imaging technologies have allowed researchers to watch activity across different regions while people think, move and respond to the world. Yet much of the brain remains difficult to understand at the cellular level. Two cells that appear almost identical under a microscope can have different molecular characteristics, respond to different signals and perform different functions. Understanding those differences has become one of the larger challenges in neuroscience.
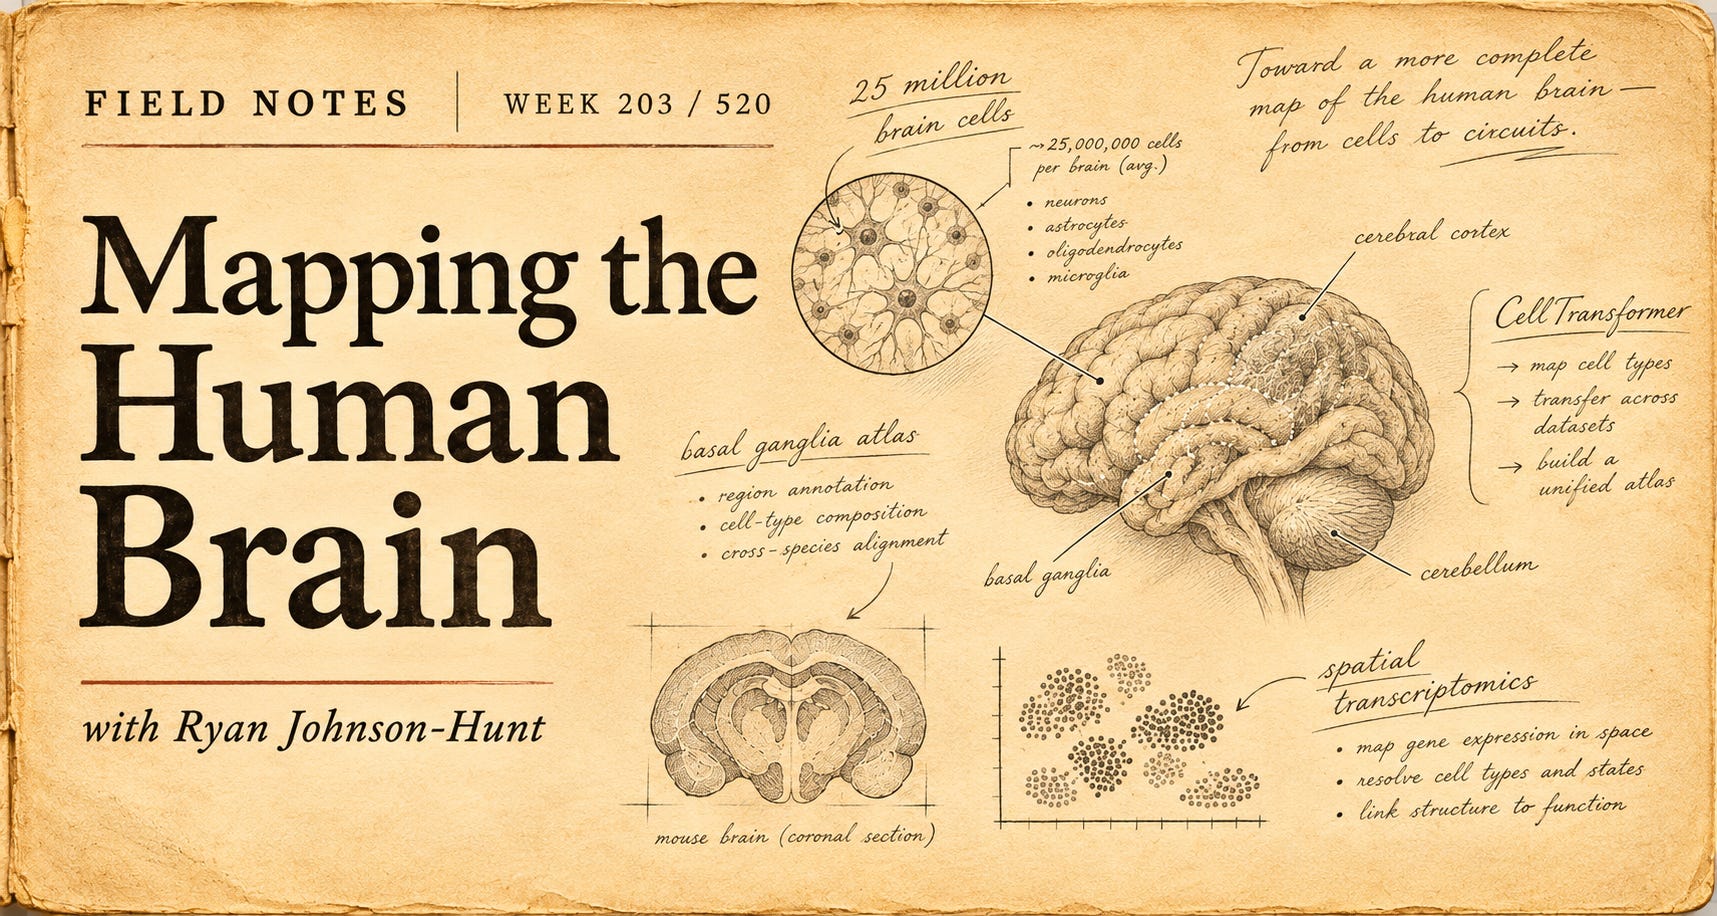
This week, an international collaboration involving hundreds of researchers across more than 50 institutions published the most comprehensive cellular atlas yet of the basal ganglia, a collection of interconnected structures deep within the brain involved in movement, habits, motivation, emotions and decision-making. The researchers analysed approximately 25.5 million individual cells, including 21 million from humans, three million from macaques and 1.5 million from marmosets. Their findings were released across a collection of papers published on 12 November as part of the US National Institutes of Health’s BRAIN Initiative Cell Atlas Network. (Allen Institute, Nature)
The scale is remarkable, although the number of cells is only part of the story. Rather than simply counting them, the researchers are constructing a detailed reference of the different cellular populations found within the basal ganglia, including their molecular characteristics, patterns of gene activity and locations within the surrounding brain structures. They achieved this by combining several technologies. Single-cell sequencing reveals which genes are active within individual cells, helping researchers distinguish different cell types. Spatial transcriptomics provides information about where cells are located and which genes they are using in those locations. Other techniques examine how the genetic instructions inside cells are regulated, giving researchers additional information about why otherwise similar cells may behave differently.
The resulting atlas brings those measurements together within a common reference that researchers around the world can use to compare their own observations. Importantly, it is not yet a complete map of the brain or a record of every connection between neurons. It is a detailed catalogue of cellular identities and their organisation within one particularly important network of brain structures. The basal ganglia were chosen partly because of their involvement in several neurological and psychiatric conditions, including Parkinson’s disease, Huntington’s disease, obsessive-compulsive disorder and addiction. Researchers have known for decades that these conditions can involve changes in the circuits passing through these regions, but identifying exactly which cellular populations are affected has been much more difficult.
The new atlas is already revealing differences that were previously hard to distinguish. One study identified six molecularly distinct zones within the human striatum, a major component of the basal ganglia. Cells that appeared relatively similar under conventional microscopy showed consistent differences in their patterns of gene expression depending on where they were located. Researchers also found that some of those molecular distinctions changed with age. (Nature).
Other parts of the project examined how cellular populations differ between individuals and species. These comparisons matter because much of our understanding of the human brain comes from experiments involving animals. A more precise reference could help researchers identify which findings are likely to translate between species and where important biological differences need to be considered.
There is something interesting about the way this research is being organised. The Human Genome Project established a shared reference for human genetic information, allowing researchers to investigate individual genes against a common framework. The BRAIN Initiative is attempting something similar for the brain’s cellular organisation, although the challenge is considerably more complicated because each cell’s behaviour depends partly on its type, location, activity and relationships with surrounding cells. The researchers are making the resulting data and analytical tools openly available. Rather than individual laboratories developing their own classifications of cells, the wider neuroscience community can begin working from a shared reference that becomes more detailed as new measurements are added.
That may prove particularly useful for understanding diseases that affect certain cells more severely than others. If researchers can identify the molecular characteristics that make a particular cell population vulnerable, they may eventually be able to investigate more targeted treatments. Those applications remain an objective of the research rather than an established clinical outcome. What stood out to me was the progression from observing structures to identifying the individual biological components within them. We have known the broad anatomy of the basal ganglia for a long time, but only recently have the tools become capable of examining millions of its cells individually and combining those observations into a coherent reference.
There is still an enormous distance between cataloguing the brain’s components and understanding how thoughts, behaviour and consciousness emerge from their interactions. The atlas does not resolve that problem, and researchers are only beginning to extend this level of detail across the rest of the brain. For now, a part of our biology that has been studied for generations is becoming visible at a level of detail that was previously difficult to imagine.

CellTransformer: AI Model Mapping the Mouse Brain in 1,300 Regions
What it is
In this short video from the Allen Institute, researchers introduce CellTransformer, an AI system developed alongside the University of California, San Francisco, to create more detailed maps of the brain using information collected from millions of individual cells. The system uses the same broad transformer architecture that underpins language models such as ChatGPT, but applies it to a very different problem. Instead of learning relationships between words, CellTransformer examines the molecular characteristics of cells and their relationships with neighbouring cells. From those patterns, it can identify distinct regions within brain tissue, including boundaries that researchers have previously struggled to define.
The research, originally published in Nature Communications in October 2025, produced a map of the mouse brain containing approximately 1,300 regions and subregions, including some that had not previously been catalogued. (Nature Communications)
What stood out
The comparison with language models is interesting because it illustrates how techniques developed for one kind of information can become useful in a completely different setting. When a language model encounters a word, its meaning depends partly on the words surrounding it. CellTransformer applies a related principle to biology, using the types and molecular activity of nearby cells to understand the characteristics of a particular cellular neighbourhood.
The system can then identify patterns across millions of cells and group them into regions based on their underlying biology. Some of these regions correspond closely to established anatomical maps, while others reveal finer distinctions that were previously difficult to recognise. What I found particularly interesting was that the researchers were able to recover much of the brain’s known organisation without explicitly teaching the system where those anatomical boundaries should be. The patterns emerged from the cellular data itself.
Why it matters
This provides an interesting companion to this week’s news about the newly published atlas of 25 million cells in the basal ganglia. As researchers develop increasingly sophisticated ways to measure the molecular characteristics of individual cells, they are also building computational tools capable of making sense of the enormous quantities of information those measurements produce. There is a distinction between knowing which cells exist and understanding how they are organised. Two regions may contain similar kinds of cells but differ in the proportions, arrangements and molecular activity of those cells. Those differences may eventually help explain why particular parts of the brain perform different functions or become vulnerable to certain diseases.
CellTransformer is still a research tool, and identifying cellular boundaries does not establish what every region does. Applying the same approach to human tissue also introduces additional complexity, particularly given the scale and diversity of the human brain. But the broader possibility extends well beyond neuroscience. The researchers suggest that similar techniques could help identify previously unrecognised patterns within other tissues, including the liver, lungs and cancers.
What interests me is how our growing ability to measure biological systems is changing the questions researchers can ask of them. We are collecting information at a level of detail that would have been difficult to manage only a few years ago, and computational tools are becoming necessary to interpret it. The maps are becoming more detailed, although understanding what all those newly visible boundaries mean remains a much longer undertaking.

Digital assets now sit less as an idea and more as infrastructure in progress. As physical and digital life continue to converge, money and digital asset infrastructure are doing the same. What was once framed as “crypto” is increasingly showing up as rails, balance sheets, and policy conversations.
Bitcoin and the wider cryptocurrency market have fallen sharply in November, driven by several overlapping factors. Expectations of higher US interest rates have strengthened the dollar and reduced demand for riskier assets. Concerns about technology valuations have also weighed on investor confidence. Meanwhile, institutional demand has weakened, with billions flowing out of US Bitcoin ETFs. Falling prices have triggered forced liquidations of leveraged positions, accelerating the sell-off. The decline reflects a broader retreat from speculative assets rather than a fundamental change in Bitcoin itself. Despite growing institutional adoption, cryptocurrency markets remain highly sensitive to global liquidity, interest rates and investor sentiment.
🔥🗺️Heat map shows the 7 day change in price (red down, green up) and block size is market cap

🎭 Crypto Fear and Greed Index is an insight into the underlying psychological forces that drive the market’s volatility. Sentiment reveals itself across various channels - from social media activity to Google search trends - and when analysed alongside market data, these signals provide meaningful insight into the prevailing investment climate. The Fear & Greed Index aggregates these inputs, assigning weighted value to each, and distils them into a single, unified score.


This section captures developments at the edge of digital systems. New interfaces, tools, and capabilities that feel early, unfinished, or slightly ahead of their moment. I’m less interested in what’s impressive today and more interested in what might quietly reshape how people work, coordinate, and interact over time.
Reading the brain without taking it apart
One of the difficulties in studying the brain is that understanding what individual cells do often requires removing them from the environment in which they operate. Researchers can separate cells from a tissue sample and examine which genes are active within each one, revealing an extraordinary amount of molecular detail. But the process loses something important: information about where those cells were located and which other cells surrounded them. That is a particular problem in the brain, where location and organisation are closely connected to function. Two neurons may have similar molecular characteristics but participate in very different processes depending on where they sit, which other cells they communicate with and how they are organised within the surrounding tissue.
A developing field called spatial transcriptomics is beginning to address that limitation. Rather than separating cells before examining their genetic activity, researchers can now measure which genes are active while preserving much of the original arrangement of the tissue. The technology played an important role in this week’s new atlas of the basal ganglia. In one of the accompanying studies, researchers at the University of California, Irvine, and their collaborators mapped approximately 7.9 million cells across several structures of the human basal ganglia, identifying 60 distinct molecular cell types and examining how they were arranged within the tissue. The study drew on samples from four human donors and combined two techniques called MERFISH+ and Stereo-seq. (Cell)
The first technique, MERFISH, uses fluorescent markers to identify RNA molecules inside individual cells. RNA provides an indication of which genes a cell is using, making it useful for distinguishing different cell types and understanding their biological activity.
Researchers prepare extremely thin sections of brain tissue and introduce specially designed molecular probes that bind to particular RNA sequences. Under a fluorescence microscope, those probes produce tiny points of light. By repeating the imaging process with different combinations of markers, the system can identify large numbers of RNA molecules while recording their positions within the tissue. Each RNA target is effectively assigned a molecular barcode, allowing software to distinguish different genetic signals from the sequence of fluorescent patterns. The result is an extraordinarily detailed image in which researchers can identify particular molecules within individual cells and see how those cells are distributed across the tissue.
Stereo-seq approaches the problem differently. Tissue samples are placed onto a surface covered with microscopic DNA structures that capture RNA molecules and record where they originated. The RNA can then be sequenced, allowing researchers to reconstruct a map of gene activity across the sample. Using extremely dense arrays of molecular markers, the technique can preserve spatial information at a scale smaller than an individual cell. (Nature)
Combining these approaches gives researchers complementary views of the same biological landscape. One provides detailed molecular imaging, while the other captures patterns of gene activity across larger tissue sections. Together, they help connect the identity of individual cells with the structures in which those cells operate. What stood out in the new research was how much organisation became visible once those two kinds of information were brought together. The researchers found that certain supporting cells accumulated near the boundaries between established compartments of the basal ganglia, while some types of neurons were concentrated in particular regions. They also identified molecular patterns that changed gradually across the tissue rather than following the anatomical boundaries previously used to describe it.
These findings suggest that some of the brain’s organisation is more continuous and complex than conventional anatomical divisions imply. A region that appears relatively uniform under a microscope may contain several distinct cellular communities, each with different molecular characteristics and relationships to its neighbours. (UC Irvine)
There are still considerable limitations. The measurements are made from preserved tissue rather than living brains, so they cannot directly show how cells behave during thought, movement or other activity. Gene expression also changes over time, meaning an individual measurement captures only part of a cell’s biological state. The technology produces enormous quantities of information that must be processed, aligned and interpreted. Researchers are still developing ways to combine these molecular maps with other measurements, including electrical activity and the physical connections between neurons.
But the potential applications extend beyond creating more detailed pictures of brain anatomy. Many neurological conditions affect particular cell populations more severely than others. Parkinson’s disease, for example, is associated with the loss of dopamine-producing neurons within circuits connected to the basal ganglia. Understanding the molecular characteristics and surroundings of vulnerable cells could eventually help researchers investigate why those cells are affected and whether more targeted treatments are possible.
The same techniques are being applied to cancer, organ development and other areas of biology where the relationship between cells and their surrounding tissue matters. What interests me is the gradual change in what it means to observe a biological system. For a long time, researchers had to choose between examining individual components in great detail and preserving the larger structure in which they existed. Technologies like spatial transcriptomics are beginning to bring those perspectives together.
The new brain atlas is one result of that effort. It doesn’t explain how the brain produces thought or consciousness, and the researchers are still some distance from connecting every cellular detail to its biological function. For now, the work is giving scientists a more precise understanding of what is actually there, including patterns of organisation that were previously difficult to see. As those measurements accumulate, the maps may become useful for questions that the researchers collecting the data haven’t yet thought to ask.

“Unfortunately, nature seems unaware of our intellectual need for convenience and unity, and very often takes delight in complication and diversity.”
Santiago Ramón y Cajal, 1906
Spanish neuroscientist Santiago Ramón y Cajal made this observation during his Nobel Prize lecture, reflecting on the intricate organisation of the nervous system.
Cajal spent much of his career studying neurons through a microscope, producing remarkably detailed drawings of their structures and connections. His work helped establish our modern understanding of the nervous system as a network of individual cells.
More than a century later, researchers are examining those same structures with molecular sequencing, advanced imaging and artificial intelligence. Where Cajal worked with stained tissue and drawings, today’s scientists can analyse millions of cells and construct digital maps showing patterns that were previously invisible.
I find it interesting that each improvement in our ability to observe the brain seems to reveal further complexity. The new atlas identifies distinctions within regions we thought we already understood, while leaving many questions about how those cells interact.
Cajal’s observation has aged rather well. We are still learning how much detail lies beneath the boundaries we draw.